

Dashboard Development Services
Etaya designs custom dashboards that bring KPIs, reports, and operational data together—helping teams monitor performance and make decisions faster.
Connect CRM, ERP, financial, marketing, and cloud data sources into a single source of truth for your business.
Custom Business Intelligence
Trusted Dashboard Development Company
Businesses generate massive amounts of data every day, but raw spreadsheets alone don't help teams make fast, confident decisions. Without a centralized dashboard, vital operational information remains scattered across spreadsheets, disconnected software platforms, and manual reports.
At Etaya, we build custom dashboard development solutions that transform complex, scattered business data into clear, actionable insights. Whether you are a growing business tracking key revenue milestones or an organization managing multi-department operations, we build secure, scalable, and user-friendly dashboards tailored to your exact operational goals.
Data Centralization
Unify spreadsheets, SaaS APIs, and database sources into one centralized operational view.
KPI Visibility
Monitor key metrics, trends, and team activity without manual reporting delays.
Automated Reporting
Schedule automated report generation in PDF, Excel, or email digests.
Scalable Foundation
Built on clean data backends designed to accommodate growing operational demands.
Tailored Solutions
Dashboard Solutions We Build
We engineer specialized business intelligence dashboards designed around the exact KPIs and reporting requirements of different business roles and departments.
Executive Dashboards
Monitor overall business health with high-level KPIs, revenue metrics, profitability, customer acquisition growth, and key operational risk indicators in one place.
Sales Dashboards
Track sales performance, conversion rates, pipeline stage velocity, regional revenue breakdown, sales rep quotas, and dynamic revenue forecasting.
Marketing Dashboards
Measure omnichannel campaign performance across Google Ads, Meta Ads, LinkedIn Ads, SEO rankings, email marketing, and web traffic analytics in real time.
Finance Dashboards
Maintain financial visibility into operational expenses, cash flow forecasts, profit margins, outstanding invoices, and department budgeting.
HR & Workforce Dashboards
Track employee attendance, recruitment pipeline efficiency, payroll processing status, performance reviews, employee retention, and overall workforce capacity analytics.
Inventory & Supply Chain Dashboards
Monitor stock levels across warehouses, track procurement lead times, supplier SLA performance, stock turnover rates, and automated reorder triggers.
Customer Support Dashboards
Analyze support ticket volume, average response times, SLA resolution compliance, CSAT scores, agent productivity metrics, and recurring issue categories.
Project Management Dashboards
Track multi-project timelines, resource allocation, budget burn rates, milestone achievements, project risk status, and engineering/design team workloads.
Dashboard Capabilities
Features of Our Dashboard Services
Our dashboards combine high-performance data architecture with modern, user-friendly interactive interface components.
Real-Time Data Streams
Stream live data feeds into interactive dynamic charts, heatmaps, gauge meters, and geographical maps.
Interactive Charts & Graphs
Custom interactive charting with multi-metric toggles, drill-down capabilities, zoom, and dynamic filtering.
KPI Monitoring & Thresholds
Set target thresholds and visual status indicators (Green/Yellow/Red alerts) for core operational metrics.
Drill-Down Analytics
Click through high-level executive cards into granular row-level data records for deeper root-cause analysis.
Multiple Data Source Integration
Seamlessly aggregate data from CRMs, ERPs, SQL/NoSQL databases, REST APIs, GraphQL, and cloud services.
Role-Based Access Control (RBAC)
Granular user permissions defining customized view and edit rights for executives, managers, and staff.
Secure User Authentication
Enterprise SSO, Multi-Factor Authentication (MFA), OAuth2, and encrypted data transport.
Automated Report Generation
Generate recurring weekly or monthly performance reports automatically without manual human intervention.
Export to Excel & PDF
One-click export of filtered dashboard views and underlying datasets into clean PDF reports or Excel sheets.
Mobile Responsive Views
Fully optimized responsive views engineered for monitoring across smartphones, tablets, and desktops.
Cloud Infrastructure Setup
Cloud availability hosted on AWS, GCP, or Azure with auto-scaling and high availability.
Custom UI Widgets
Bespoke dashboard widget components designed around your unique business workflows.
Scheduled Email Summaries
Automated email digests delivering regular KPI snapshots straight to executive and managerial inboxes.
Alert Notifications
Web and mobile alert notifications when critical metrics cross defined anomaly or target limits.
Dark & Light Theme Support
Sleek, eye-friendly light and dark interface themes customized to match your company's visual branding.
Disciplined Workflow
Our Dashboard Development Process
We follow an agile 8-step methodology to ensure your dashboard is built on solid data logic, intuitive design, and robust security.
Discovery & Business Analysis
We analyze your business objectives, reporting needs, existing software infrastructure, and decision-making workflows.
KPI & Data Architecture Planning
We define precise calculation logic for every key performance indicator and model data schemas for performance.
Wireframing & UI/UX Design
Our UX designers craft intuitive dashboard wireframes and modern visual interfaces focused on rapid data comprehension.
Data Integration & Pipeline Setup
We connect APIs, databases, CRM platforms, ERP systems, spreadsheets, and cloud data sources with pipelines.
Front-End & Back-End Development
Our engineering team builds responsive web dashboards using modern frameworks and clean code principles.
Testing & Quality Assurance
Every dashboard is thoroughly tested for calculation accuracy, query performance, responsiveness, and security.
Deployment & Infrastructure Setup
We deploy the dashboard to your cloud environment (AWS/GCP/Azure) or internal servers with deployment strategies designed to minimize service disruption.
Maintenance & Enhancements
We provide system health monitoring, API maintenance, performance tuning, and new report additions based on project requirements.
Tech Stack
Technologies We Harness
We select established frontend frameworks, robust API backends, databases, and BI platforms matched to your system requirements.
Frontend Frameworks
- React
- Next.js
- Angular
- Vue.js
- TypeScript
- Tailwind CSS
Backend & APIs
- Node.js
- Python
- .NET Core
- Laravel
- REST APIs
- GraphQL
Databases & Warehouses
- PostgreSQL
- MySQL
- MongoDB
- SQL Server
- Redis
- Snowflake
BI & Visualization
- Power BI
- Tableau
- Looker Studio
- Apache Superset
- Chart.js
- D3.js
Cloud & DevOps
- AWS
- Microsoft Azure
- Google Cloud
- Docker
- Kubernetes
- CI/CD Pipelines
Systems Connected
Systems Your Dashboard Can Connect With
Depending on your existing technology stack, data access, and available APIs, custom dashboards can combine information from CRM, ERP, finance, marketing, commerce, cloud, database, spreadsheet, and custom business systems.
Industry Experience
Industries We Serve
We build custom dashboards tailored to the specific operational and metrics demands of businesses across sectors.
Business Impact
Benefits of Custom Dashboards
Save Time & Reduce Manual Effort
Reduces time spent consolidating spreadsheets and preparing recurring reports.
Make Informed Decisions Faster
Provides clear visibility into business metrics, allowing team leads to spot trends and make informed decisions faster.
Increase Operational Focus
Gives teams one central location to view key performance indicators instead of searching across multiple tools.
Enhance Cross-Department Alignment
Shares customized views securely across departments, helping teams align on the same operational data.
Identify Risks Earlier
Visualizes operational trends, inventory levels, and key performance indicators before they create bottlenecks.
Scalable Technical Foundation
Built with modular architecture that can accommodate additional data sources and users as requirements grow.
Our Approach
Why Choose Etaya?
Product + Engineering Under One Team
UX design, frontend crafting, API services, database indexing, and deployment are handled as one connected implementation.
Built Around Business Decisions
We start by analyzing the specific decisions, KPIs, workflows, and users your dashboard needs to support rather than starting with generic charts.
Integration-First Architecture
Dashboards are designed around your existing data sources and software ecosystem rather than creating isolated reporting tools.
Custom to Operational Workflows
Permissions, views, filters, and reporting flows are tailored directly around how your different teams actually use operational data.
Scalable Technical Foundation
We structure the technical architecture so data feeds, users, metrics, and dashboard modules can expand as your organization grows.
Operational Applications
Dashboard Development Use Cases
Here are common operational workflows our custom dashboard solutions support:
Relevant Work
Featured Dashboard Projects & Case Studies
Explore specialized business intelligence, geospatial, financial, fitness, industrial, and marketplace dashboard interfaces built by Etaya.
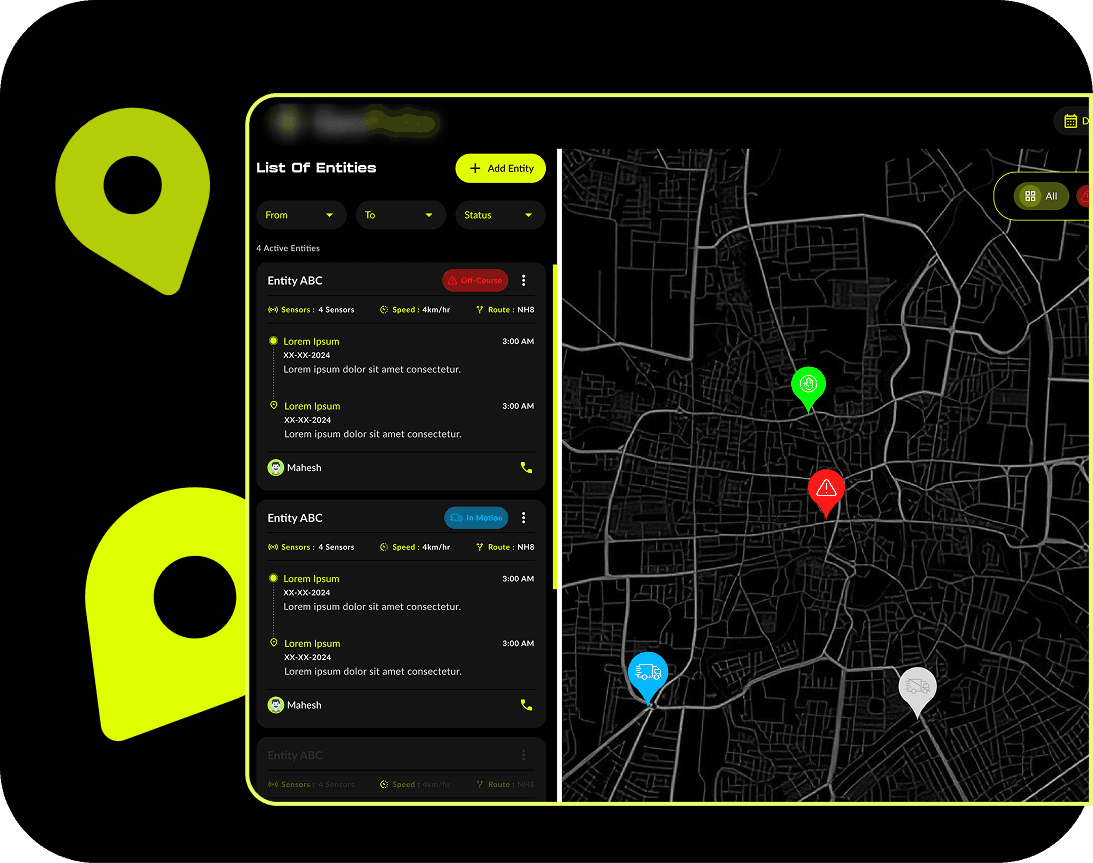
Geospatial & Fleet Tracking Dashboard
GeoPulse Platform
Location intelligence and map-based dashboard layout crafted for tracking assets, shipments, and field operations in real time.
Interface Capabilities Designed:

Financial Operations & Analytics Dashboard
Cashpromise Platform
Financial transaction tracking, revenue metrics, payment gateway monitoring, and customer reconciliation dashboard.
Interface Capabilities Designed:
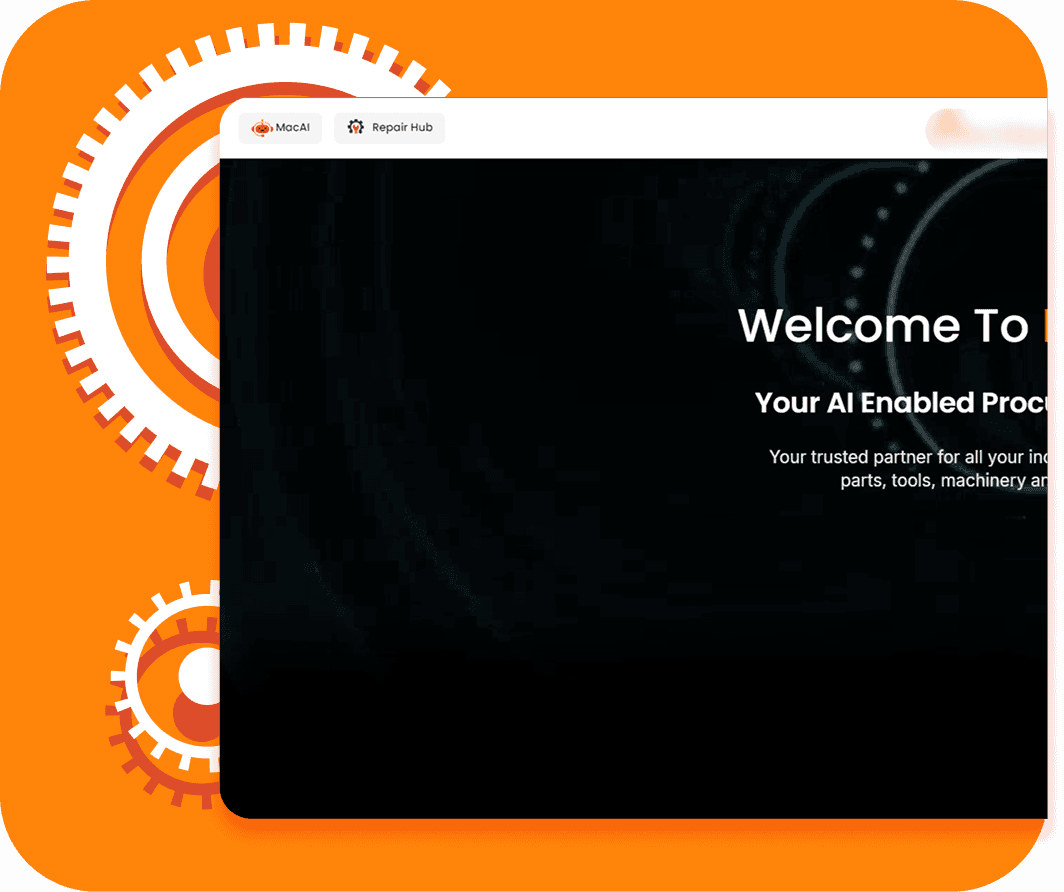
Industrial Procurement & Supply Chain Dashboard
Machanas Platform
B2B industrial procurement and supply chain management interface designed for order tracking, inventory SLAs, and vendor workflows.
Interface Capabilities Designed:
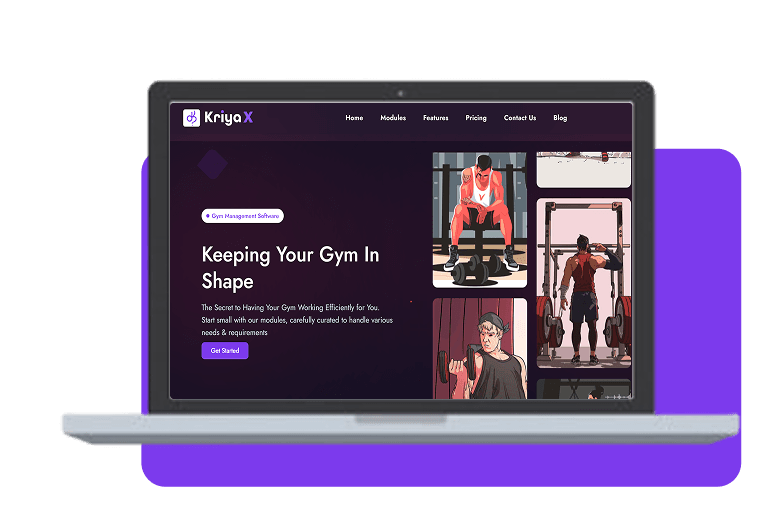
Gym & Fitness Management Dashboard
KriyaX Platform
Comprehensive fitness center operational dashboard managing member subscriptions, trainer schedules, attendance, and revenue analytics.
Interface Capabilities Designed:
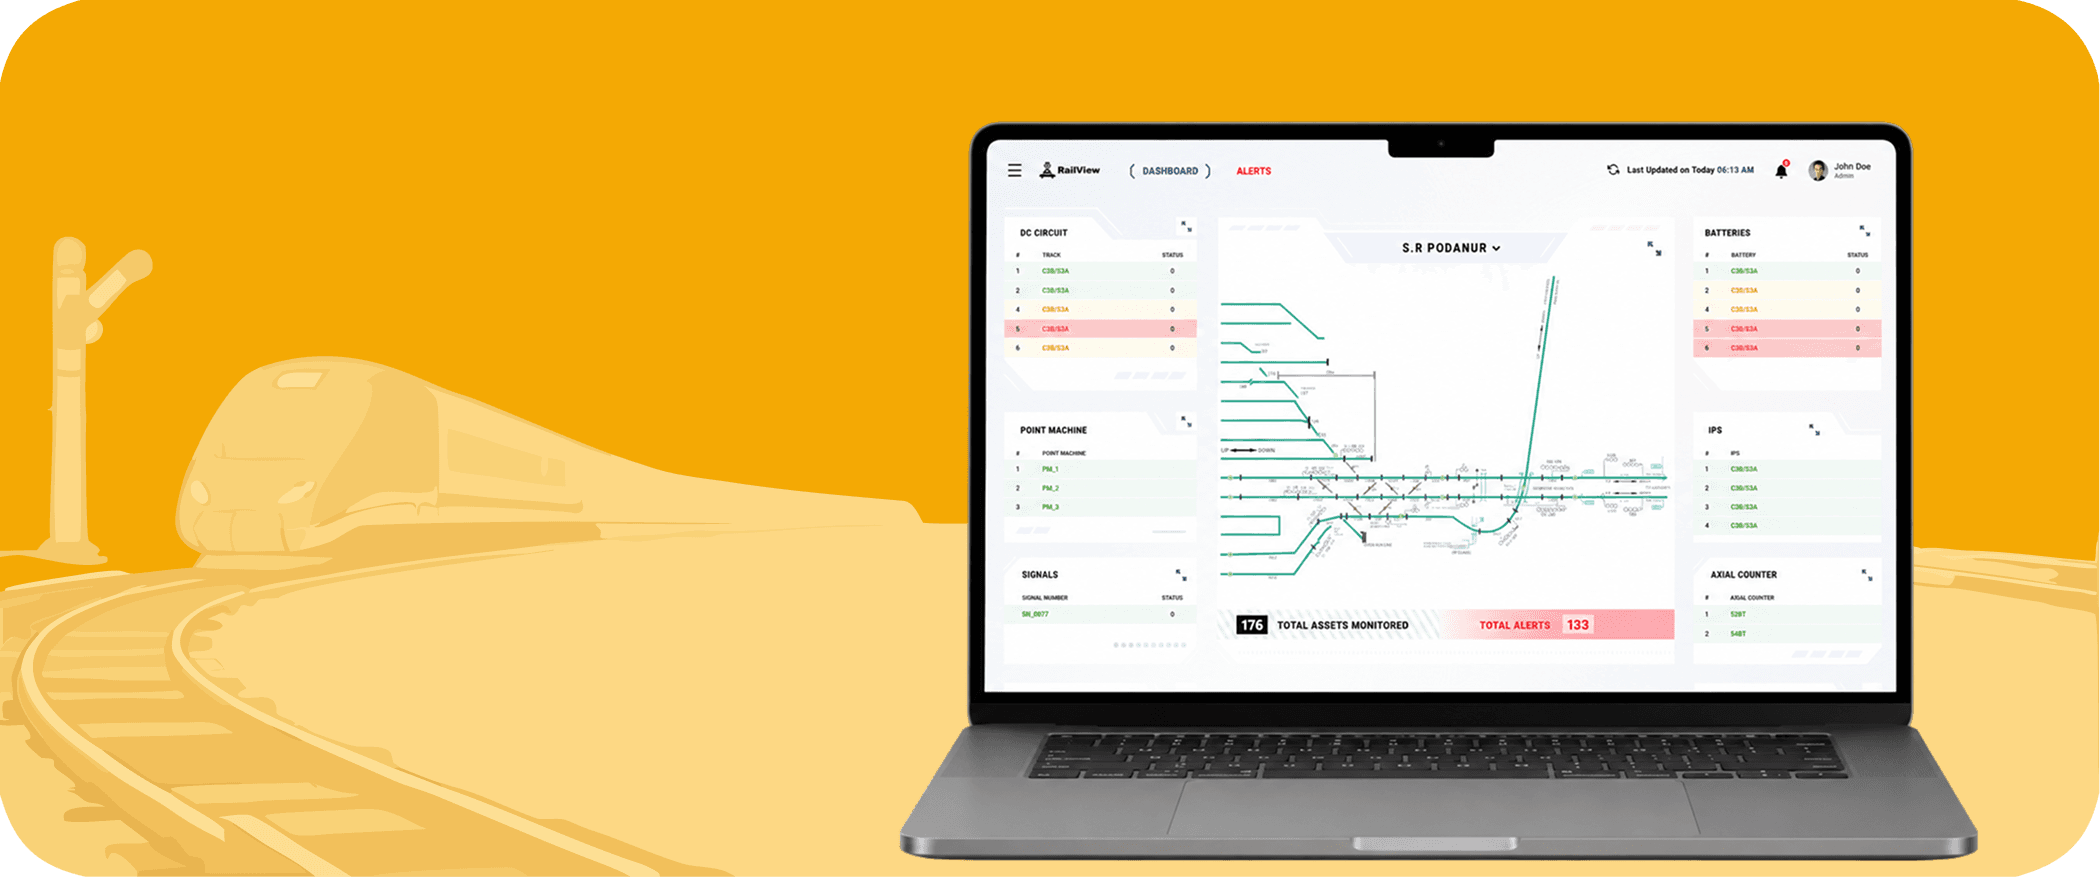
Signalling & Diagnostics Operations Dashboard
Railview Platform
Industrial rail telemetry, diagnostics tracking, and infrastructure monitoring dashboard for equipment health and maintenance alerts.
Interface Capabilities Designed:

B2B Marketplace & Merchant Analytics Dashboard
LetsB2B Platform
Wholesale B2B marketplace platform dashboard tracking vendor performance, merchant onboarding, bulk order volumes, and trade analytics.
Interface Capabilities Designed:
Got Questions?
Frequently Asked Questions
Clear answers regarding custom dashboard development costs, timelines, integrations, and mobile support.
What is dashboard development?
+
Dashboard development is the process of creating custom interactive software that aggregates, organizes, and visually displays key business data from multiple sources into a single centralized view. It allows leaders and teams to monitor real-time KPIs, analyze trends, and make informed operational decisions efficiently.
How much does dashboard development cost?
+
The cost of custom dashboard development depends on several factors, including the number of dashboards, the complexity of data integrations (APIs, ERPs, CRMs, databases), custom UI widget requirements, user access roles, and real-time streaming needs. At Etaya, we provide customized, phased project proposals tailored specifically to your business goals and budget.
How long does dashboard development take?
+
Focused custom dashboards with standard database or API integrations typically ship within 3 to 5 weeks. Larger business intelligence solutions requiring complex ETL pipelines, multi-role security access, and custom visualizations generally take 8 to 14 weeks, delivered in launchable sprint phases.
Can you integrate dashboards with our existing software?
+
Yes. Depending on data access and available APIs, we connect dashboards directly with existing CRMs (Salesforce, HubSpot, Zoho), ERP platforms (SAP, Oracle, Dynamics), accounting software (QuickBooks, Xero), databases (PostgreSQL, MySQL, MongoDB), payment platforms, ad services, and custom REST or GraphQL APIs.
Are your dashboards mobile responsive?
+
Absolutely. Every custom dashboard we build is fully responsive and engineered to deliver an intuitive user experience across desktop screens, tablets, and mobile devices.
Can dashboards update automatically in real time?
+
Yes. We build custom dashboards supporting automated scheduled updates (e.g., hourly, daily) as well as real-time data streaming based on your specific operational requirements.
Do you provide ongoing maintenance and technical support?
+
Yes. We offer post-deployment maintenance, system health monitoring, data pipeline updates, security patches, performance tuning, and ongoing feature additions as project requirements expand.
Related services
Explore Services That Complement This One
Explore complementary capabilities clients often combine with this service.
Business Intelligence Dashboards
BI dashboards that give owners and teams a clear view of performance, operations, and next actions.
Data Infrastructure Design
Data infrastructure planning for businesses that need cleaner storage, flow, reporting, and automation readiness.
Backend & API Development
Backend and API development for products that need reliable logic, integrations, and secure data flow.

Let's talk
Ready to Turn Your Data Into Action?
Stop relying on spreadsheets and disconnected reports. Partner with Etaya to build a custom dashboard that provides real-time visibility into your business performance.
Prefer a live conversation? Book a Dashboard Development Services strategy call